
Blog
How to Interpret Science Graphs Accurately
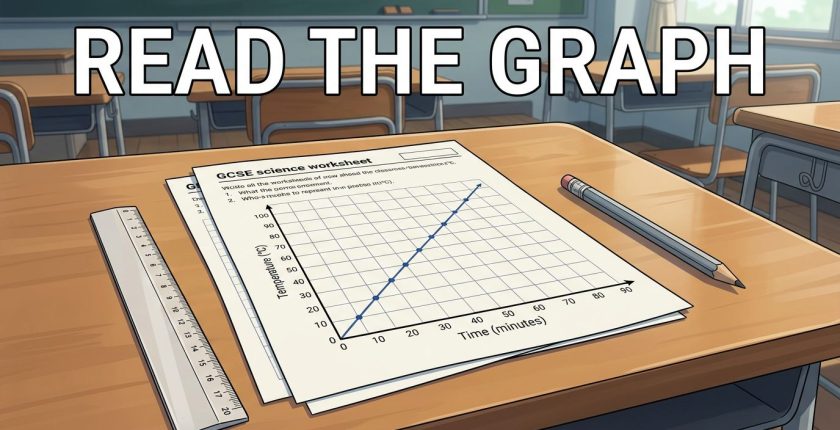
To interpret science graphs, check the axes and units, identify the pattern, then support your answer with values. Calculate a gradient only when the question needs a rate of change.
Most lost marks come from misreading scales, giving vague descriptions or missing units. A reliable method makes unfamiliar graphs easier to handle and keeps your answers focused on the evidence. Start with what the graph measures before deciding what it means.
Read science graphs in a fixed order
Use this sequence before writing your answer:
- Read the question. Identify whether it asks you to describe, explain, compare or calculate. These instructions require different answers.
- Check both axes and units. Read the labels carefully. Temperature in °C and time in seconds mean different things, even when graphs look similar.
- Work out the scale. Divide the difference between labelled values by the number of intervals. Check for axis breaks and axes that don’t start at zero.
- Identify the overall pattern. Look for increases, decreases, plateaus, peaks and changes in steepness. Then identify any anomalous points.
- Select evidence. Read useful coordinates and include units. For comparisons, choose values at the same x-axis position.
The independent variable is what you change. The dependent variable is what you measure in response. Put the independent variable on the x-axis and the dependent variable on the y-axis.
For example, in a photosynthesis investigation, light intensity may be independent and oxygen production dependent. Time is usually independent when recording change over time.
Choose the right graph for the data
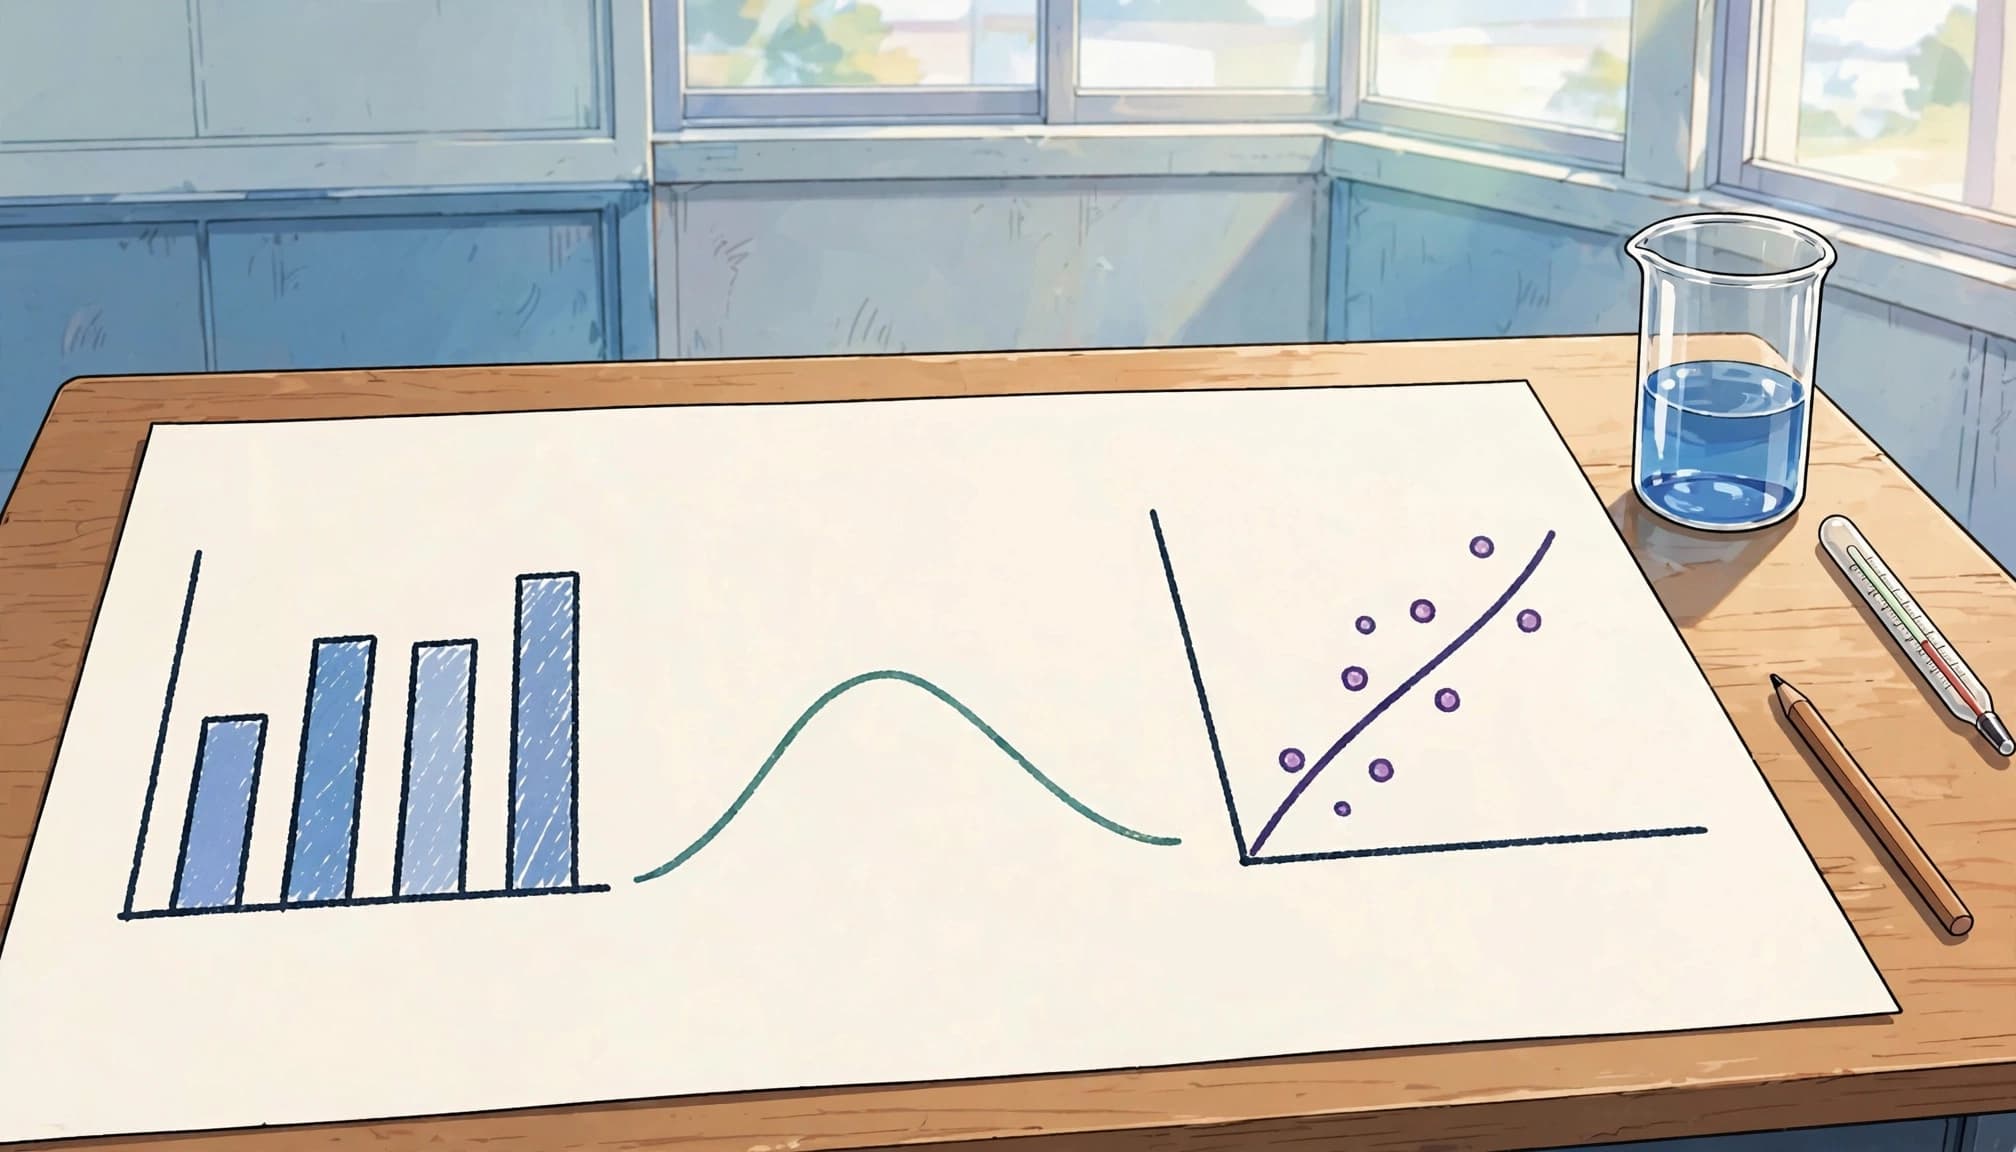
The choice depends on whether your values are categories, continuous measurements or proportions. BBC Bitesize’s comparison of graph types distinguishes these formats.
Categories and grouped measurements
Use a bar chart for categorical data or separate discrete values, such as plant species or numbers of offspring. Make bars equal in width and leave gaps between them.
A histogram shows grouped continuous data. Its bars touch because the measurements form a continuous scale. For heights recorded to the nearest centimetre, groups such as 130-134 and 135-139 don’t overlap. With unequal class widths, histogram height represents frequency density.
Continuous relationships and proportions
Use a line graph for continuous data, such as temperature against reaction rate. A scatter graph explores a relationship between paired measurements, such as height and mass.
Pie charts show proportions of a whole. Because a circle contains 360°, dividing by 100 gives 1% = 3.6°. Therefore, a 25% section needs an angle of 25 × 3.6 = 90°.
Use a protractor to measure each sector accurately. You may arrange sectors in size order to make the chart easier to read, but the important requirement is that each angle correctly represents its proportion.
Plot data accurately, then draw the best fit
For a chemistry plotting exercise, use these time and gas-volume pairs.
| Time / s | Gas volume / cm³ |
|---|---|
| 0 | 0 |
| 10 | 12 |
| 20 | 24 |
| 30 | 36 |
| 40 | 48 |
The values increase evenly, so they should form a straight line.
- Choose useful scales. Put time on the x-axis and gas volume on the y-axis. Scales of 0 to 40 s and 0 to 50 cm³ accommodate every point. Use most of the available grid.
- Label the graph. Write each quantity and unit, such as “Time / s”. Add a clear title, for example “Gas volume against time”.
- Plot carefully. Locate each x-value, move to its matching y-value and mark a small pencil cross. Aim within half a small square; marking tolerances aren’t permission to plot roughly.
- Draw the appropriate line. Use a ruler for this straight relationship. Don’t automatically join neighbouring points.
Identify trends, correlation and anomalies
Describe the whole pattern
Positive correlation means both variables increase together. With negative correlation, one decreases as the other increases. No correlation means the points show no clear relationship.
BBC Bitesize’s scatter graph guidance shows how point patterns reveal relationships between measurements.
Describe changing sections too. “The rate increases, then levels off” is more accurate than “the rate increases” when a curve reaches a plateau.
Also, distinguish a straight line from direct proportionality. Directly proportional quantities form a straight line through the origin.
Handle best-fit lines and outliers
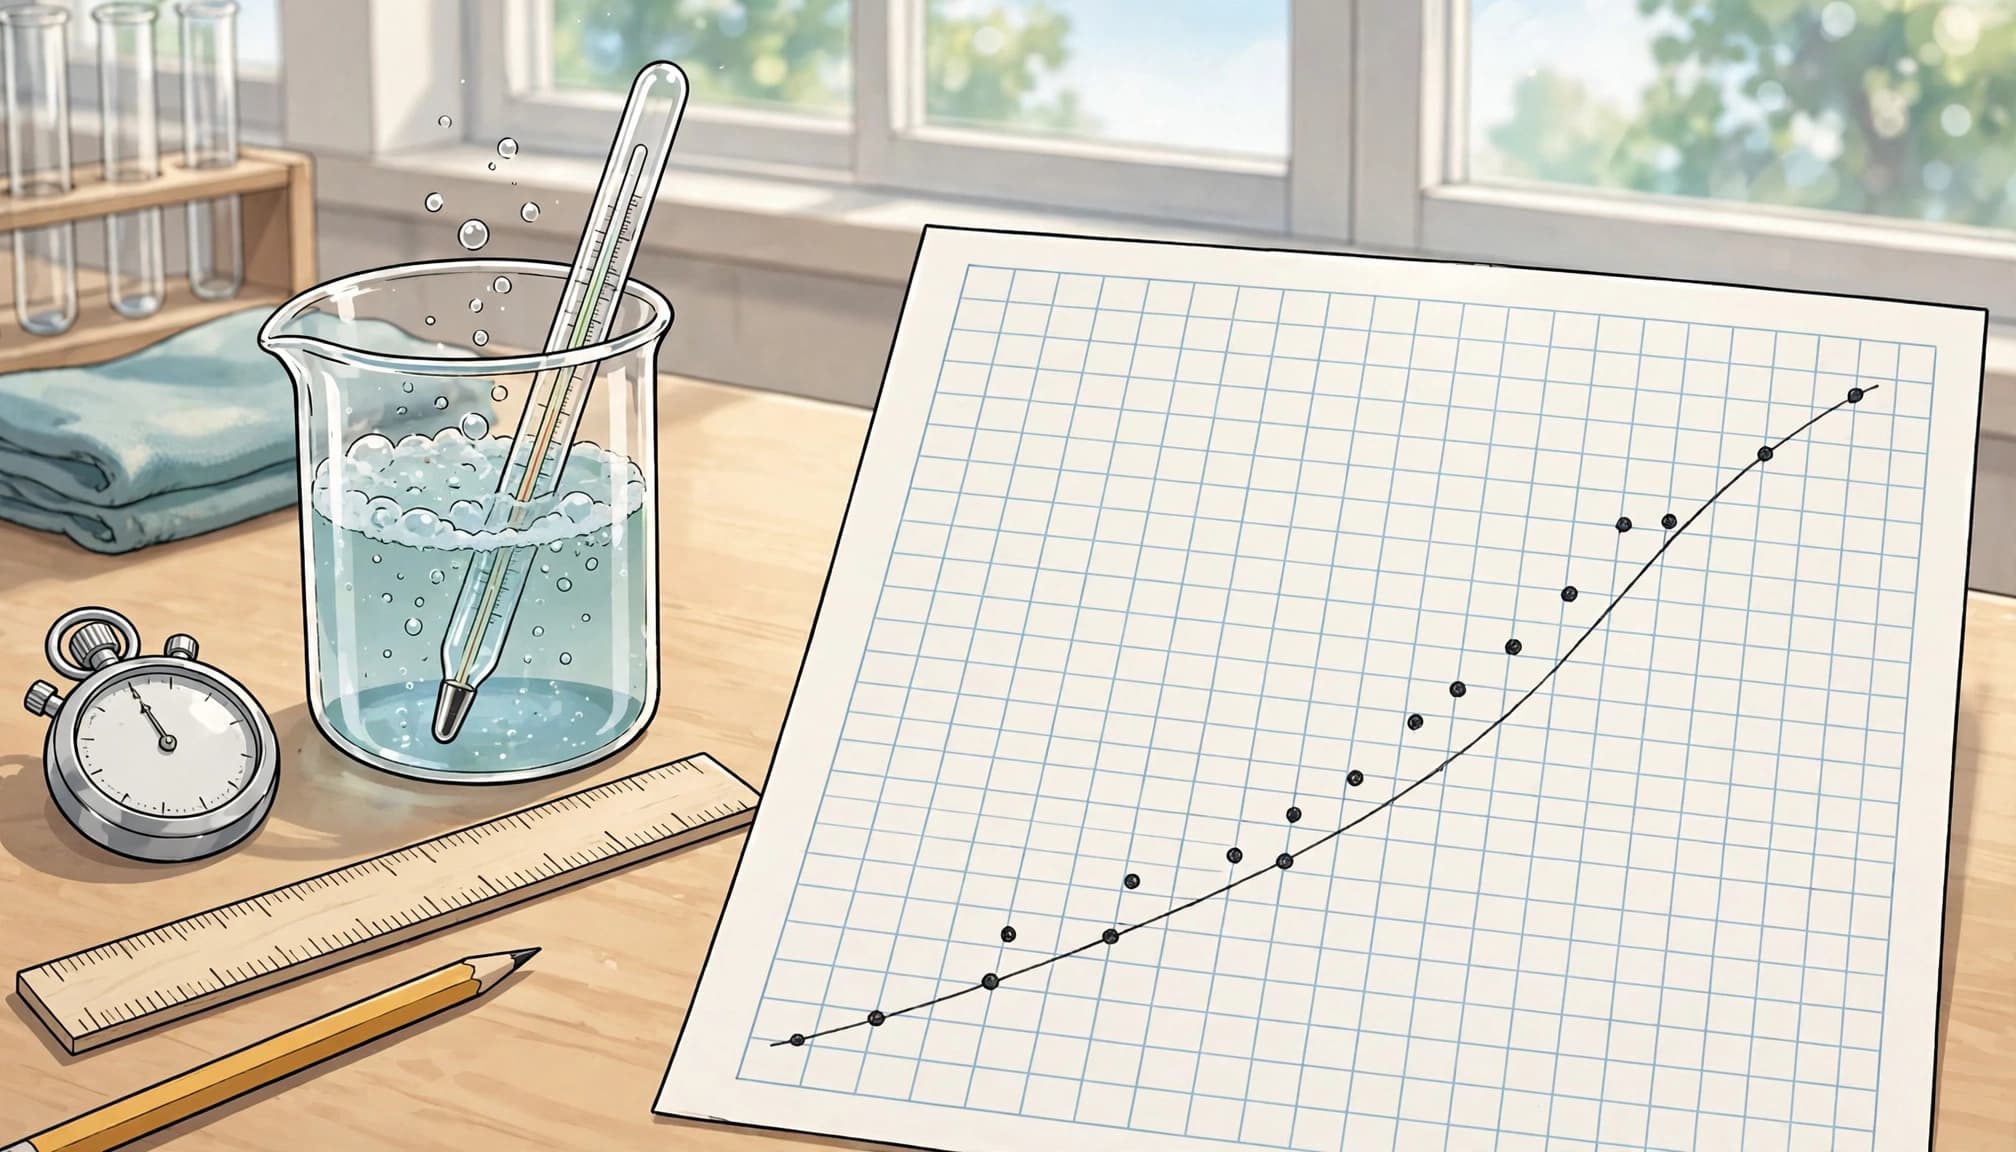
A line of best fit is a smooth straight line or curve passing close to the points. Aim for roughly equal numbers above and below it, rather than a dot-to-dot zigzag. BBC Bitesize’s guide to using graphs explains how best-fit lines show the overall relationship.
An anomalous result lies away from the general pattern. Ignore a clear anomaly when drawing the best-fit line, but don’t erase the result or invent a cause.
Repeated measurements can help establish whether a result is anomalous. One unusual point alone doesn’t prove that the experimenter made a mistake.
Correlation alone doesn’t prove that changing one variable caused the other to change.
Support conclusions with data and science
Describe what happens, then explain why
A description states the pattern. An explanation adds a scientific reason. BBC Bitesize describes graph interpretation as finding patterns in measured data; explaining those patterns also requires subject knowledge.
For the chemistry table, write: “Gas volume increases from 12 cm³ at 10 s to 36 cm³ at 30 s.”
In biology, a photosynthesis graph may rise with increasing light intensity, then plateau. Explain that light initially limits the rate; at the plateau, another factor, such as carbon dioxide concentration, limits it.
Use “because” to connect a claim to its mechanism. The distinction between these responses is central to understanding exam command words.
Compare curves fairly
Compare values at the same time, temperature or other x-axis position. Include similarities and differences rather than describing each curve separately.
For cooling curves, compare temperatures after the same elapsed time. If starting temperatures differ, compare temperature changes or cooling rates.
Use “however” when the relationship changes across the graph. Avoid claiming that one curve is always higher if the curves cross.
Calculate gradients with the correct units
Straight lines: use a large triangle
Gradient = change in y ÷ change in x
Choose two widely separated points on the line of best fit. They don’t have to be original plotted points. Read their coordinates and subtract in the same order:
Gradient = (y₂ − y₁) ÷ (x₂ − x₁)
For the chemistry table:
Gradient = (48 − 12) ÷ (40 − 10) = 36 ÷ 30 = 1.2 cm³/s
This is the rate of gas production.
In physics, a distance-time line passing through (2 s, 6 m) and (8 s, 24 m) has gradient:
(24 − 6) ÷ (8 − 2) = 3 m/s
On a distance-time graph, gradient gives speed. On a velocity-time graph, it gives acceleration. Therefore, always interpret the gradient using the axis quantities.
Curves: distinguish instantaneous and mean rates
To find the gradient at one point on a curve, draw a tangent. This straight line touches the curve at the chosen point and matches its slope there.
Choose two widely separated points on the tangent, then calculate change in y divided by change in x.
For a mean gradient over an interval, join the two selected points on the curve with a straight line. Calculate that line’s gradient.
For example, a tangent to a gas-volume curve gives reaction rate at that moment. A line joining two points gives the average rate between those times.
Distinguish interpolation from extrapolation
Interpolation estimates a value within the range of collected data. Using the chemistry table’s line, the predicted gas volume at 15 s is 18 cm³.
Read upwards from 15 s to the line, then across to the volume axis. Use the line of best fit rather than the nearest individual point.
Extrapolation extends the best-fit line beyond the measured range. Predicting volume at 60 s would be extrapolation because measurements stop at 40 s.
Extrapolation is less secure because the relationship may change. A reaction may slow as reactants run out, so continuing an early straight line can overestimate later gas production.
Turn marking feedback into better graph answers
Graph-drawing questions often assess suitable scales, labelled axes and units, accurate plotting, and an appropriate best-fit line. The exact mark allocation varies, so treat these as separate checking points rather than assuming each earns one mark.
For calculations, show the chosen coordinates, subtraction, division and final unit. Clear working makes your method visible even if arithmetic goes wrong.
Practise questions without notes first. Then use the matching mark scheme to identify whether lost marks came from scale reading, missing evidence or an incorrect method. This approach to marking practice test papers makes corrections more useful than a score alone.
If individual support would help with calculations or scientific explanations, Find your tutor here.
If you choose to purchase a product or service through one of these links, we may receive a commission at no additional cost to you. Any recommendations are provided for informational purposes only.